

JPY Appreciation

In this newsletter, we will talk about the the events that led to Monday’s global market decline.
We all know and appreciate that markets have their ups and downs. It’s just the nature of the game, and we accept that volatility is part of the deal. Despite acknowledging this fact, it is natural to feel jittery when prices take sudden, dramatic turns—like they did on Monday.
Such sudden drops can trigger fear and self-doubt which can lead to hasty decisions, like panic selling, which might not be necessary. Now, extreme volatility can be a blessing or a curse, depending on its causes, duration, etc, and most importantly, how you deal with it inside your head.
While we can’t predict the future post an event like Monday (I mean if I could, I wouldn’t be here writing this article—I’d be on a world tour with my billions!), but we can try to understand what caused investors across the globe to act a certain way?
Let’s start with building a base which will make sure that we are able to build our tower of understanding and insight with great ease.
What is Carry Trade?
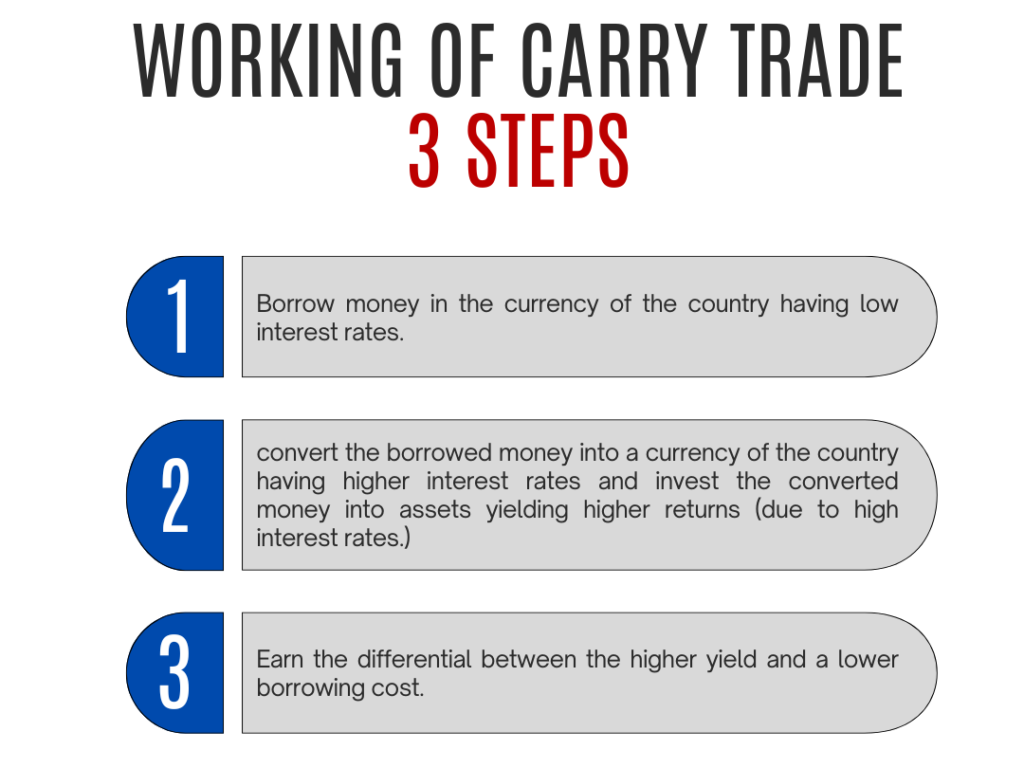
The term carry trade is derived from the concept of “carrying” an asset over time to earn a return. In financial markets, the term “carry” refers to the cost or benefit of holding an asset. Therefore, in simple terms, a carry trade is like borrowing money from a place where it costs less and putting it in a place where you can earn more, and then keeping the extra profit for yourself. Simple, isn’t it?
Talking about financial markets, this activity of “carry trade” is very popular in the currency markets. This is how it works, involving THREE steps:
Obviously, there are reasons for this type of trade being attractive and other nuances, but let’s leave that for another day. What was important was to understand carry trade at a basic level, which we have already discussed.
Yen Carry Trade – Most popular of the lot
So, the way this typically works is that you borrow in Yen (Interest rate in Japan are lower than the USA), convert it into USD, and invest in higher-return markets. Earn a profit from the difference in yield that comes by investing in high yielding US assets and low borrowing in Japan. Plain and Simple! But the reversal of this trade has led to the recent global market downturn. Let’s dig deeper to understand how we arrived at today’s condition.
Another building block before we dive in: when a currency depreciates, exports benefit. To explain this, let’s meet Mr. Export from India, who sells chairs to the USA.
Mr. Export’s Chair Export
Mr. Exporter sells 10 chairs from India to the USA, each costing Rs. 100 to produce.
Total Production Cost in INR: Rs. 1,000 (10 * 100)
Selling Price in USD: $2 per chair
Total Revenue in USD: $20 ($2 * 10)
Revenue in INR: $20 x 80 (USD/INR exchange rate) = Rs. 1,600
Currency Depreciation:
Assume that INR depreciates, and now $1 = Rs. 88.
New Revenue in INR: $20 x 88 = Rs. 1,760
Extra Earnings: Rs. 1,760 – Rs. 1,600 = Rs. 160
With the same $20 revenue, Mr. Export now earns more rupees due to the currency depreciation. This makes his chairs more competitive internationally, as he can lower prices to attract more buyers or enjoy higher profit margins. Conversely, if the currency appreciates, he earns fewer rupees, making his business less competitive.
The simple rule, currency depreciation makes exports more competitive, and appreciation makes them less competitive.
Now, as we move to the main story, understand that the global markets are deeply interconnected. One action can trigger multiple reactions, both immediate and delayed. Nothing happens in isolation. So to understand today’s condition, let’s take a trip down economic history lane to the bustling 1980s and 1990s.
Before China there was Japan
After World War II, Japan rapidly rebuilt and industrialized, focusing on steel, shipbuilding, and textiles. A depreciated yen made Japanese goods highly competitive globally. The top-notch quality ensured by Japanese companies and heavy investments in R&D led to technological advancements, allowing Japan to produce high-tech goods at lower costs. Over the years, Japanese products dominated global markets, with consumer electronics and automobiles outpacing competitors in the USA and Europe. From the mid-1950s to the early 1970s, Japan’s economy grew 9-10% annually, which was backed by strong fundamentals and a culture of thrift and savings in Japanese households. By 1968, Japan had become the world’s second-largest economy, and by the 1980s, it was a leading global exporter, with companies like Toyota, Sony, and Panasonic becoming household names.
Then America happened.
The Plaza Accord: The Collapse of Fiscal Discipline
By the mid-1980s, Japan’s massive trade surplus with the U.S. caused friction, as the strong dollar made American goods expensive and Japanese goods cheaper, worsening the trade deficit. This pressured U.S. manufacturers, leading to calls for intervention. On September 22, 1985, the Plaza Accord was signed by the G-5 nations—France, West Germany, Japan, the UK, and the USA—to depreciate the dollar and appreciate the yen and German mark. This wasn’t ideal for Japan’s export-led economy, but U.S. pressure, including threats of tariffs and the influence of U.S. military bases in Japan, nudged Japan to agree.
This shocked Japan’s export industries. To counter this, the Japanese government implemented expansionary policies, and the Bank of Japan (BOJ) slashed interest rates from 5% in January 1986 to 2.5% by February 1987. Financial deregulation made credit easily accessible, introducing new instruments like commercial paper, futures and options. This sparked a speculative boom in real estate and stocks, drawing in everyone from office workers to housewives. Suddenly, people who had never invested before were buying stocks, convinced prices would keep rising.
As a result, the Nikkei 225 (the major index in Japan) skyrocketed from 6,867 in 1980 to a peak of 38,915 by the end of 1989.

Japan Real Estate: In the 1980s, commercial real estate prices in Japan’s six largest cities quadrupled. At one point, all the land in Japan was valued at more than 4x that of the entire United States, despite the U.S. being 25x larger. Tokyo’s land alone was considered more valuable than all U.S. land, and the Imperial Palace grounds were said to be worth more than all of California. Crazy, isn’t is?

The Bubble Burst & Yen Depreciation
To curb the economic frenzy and prevent Japan’s economy from overheating, the BOJ tightened monetary policy in 1989-90, causing asset prices to plummet. By early 1992, the Nikkei index had dropped 60% from its peak, and land prices continued to fall till the end of the decade. This collapse led to a buildup of non-performing loans, hitting financial institutions and causing a credit crunch. The burst bubble ushered Japan into the “Lost Decade“, with the country facing prolonged economic stagnation, low growth, and deflation.
To combat deflation, the BOJ gradually lowered interest rates, reducing them from 2% to 0.5% by 1995. In February 1999, the BOJ officially adopted a zero-interest rate policy to halt the economic downturn. In 2001, they introduced quantitative easing, expanding the money supply by purchasing government bonds and other assets. Despite these measures, the economy continued to struggle.

So, Japan struggled with deflation, aging population, as well as the rise of other competitive Asian countries like China taking over its position as export leaders.
This condition has persisted till date with normal ups and downs. This brings us to the current situation.
Investor love for JPY
Due to Japan’s long-term low-interest-rate policy, it has become a significant global funding source (recall Yen carry trade discussed above). Recent reports from the Bank for International Settlements (BIS) show that cross-border Yen borrowing has surged by $742 Bn since the end of 2021, with carry trade being the primary reason. The investors not only borrowed but also shorted the yen, causing it to depreciate significantly to over 160 yen per dollar recently, a level not seen since 1990.

The key assumption here has been that the yen will keep falling, allowing continued cheaper borrowing that will be invested in higher-yield currencies or assets. It’s historically cheap money available to take and invest without paying anything meaningful for it—a leveraged-led pure-profit play. What could go wrong, right?
Turns out a lot!
Never Say Never – Catching investors off guard
Recently, Japan has shown signs of recovery. The economy is expected to show good growth in the second half of 2024 due to the highest wage growth in three decades, moderate inflation, and a weak yen boosting exports. Consequently, the Bank of Japan raised its interest rate to 0.25% in July 2024 and will reduce bond-buying to JPY 3 Tn monthly by early 2026 from the current pace of around JPY 6 Tn. This caused the yen to surge over 10% against the dollar in a month. While not officially stated, the BOJ’s actions have also helped prevent further yen depreciation, which could have led to higher fuel and food prices, given Japan’s reliance on imports for fuel.
This took everyone by surprise. By increasing the interest rate and slowing down bond buying, the BOJ stopped the yen’s depreciation and conversely, resulted in its appreciation.

This disturbed the status quo and led to “carry trade” losses in two ways: a) borrowing costs increased, reducing arbitrage profits, and b) the yen strengthened while the dollar depreciated. This resulted in increasing repayment amounts and reducing asset values. Consequently, investors began unwinding their positions globally, causing market declines, including Japan’s Nikkei 225.
Ideally, this could have been mitigated with forex hedging, but the high hedging costs of JPY/USD since 2022 likely kept hedge ratios low. The nearly free money affected many markets since the borrowed money was invested in many markets, including Japan, that had high-yielding investments.
In short, the yen’s appreciation led to widespread selling. The global sell-off was basically the result of traders unwinding their trades to cut further losses. However, countries like India, with a strong presence of domestic investors, saw smaller declines compared to others.
Coming back to the earlier point, global markets are highly interconnected, and one action can trigger multiple reactions, both immediate and delayed. What we saw on Monday was this playing out in real-time.
What next?
The strengthening of the yen is unprecedented, at least in many decades. However, it is important to appreciate the fact that an era of “free money” was an anomaly, not the higher interest rates in Japan.
Also, sincere apologies for the bad news, but predicting what happens next is really close to impossible (like I said earlier, if I knew, I’d be sipping a coconut at my beach house in the Bahamas). All we know is that all the markets, including Nikkei 225, which saw the biggest decline since the Black Monday in October 1987, recovered most of their losses on Tuesday.
Now that we have understood everything important related to the series of events that cause the steep fall on Monday, I would like to conclude with a confession. Macro indicators constantly change, and you will seldom find a perfect world without worries. The bottom line is that if you are a long-term investor, you should not base your decisions solely on these metrics or get worried about them. What matters most are the fundamentals of your investments and the price you pay to acquire them. You are covered until both of the above are taken care of. Macro factors, in the long run, rarely affect your return. So, it’s good to know about macros from a knowledge enrichment perspective, but do not let it get in the way of a good night’s sleep.
✍🏻Author of this newsletter – Adnan (Twitter)
Fin Meme of the Week

Follow us
If you are a diligent investor, you would not want to miss checking out our research platform, where we share insightful research on companies regularly. Gain access to our sample research by clicking on the button below.