


All you need to know about market euphoria and principles that can help you dodge the pain that comes after it ends

In this edition of LEARNING OF THE WEEK, we’re unpacking the dynamics of investing bubbles, exploring why certain stocks trade at sky-high P/E ratios, and sharing timeless principles to help you navigate market euphoria with confidence. Our discussion draws inspiration from a brilliant memo by one of our investing idols, Howard Marks, CIO and Co-Chairman of Oaktree Capital Management.
Stock Market Situation in India vs the USA
If you track the news flow surrounding the Indian and the US equity markets, in all probability, you would be aware of the fact that both Indian and US equity markets are near to their all-time highs – but the forces driving them couldn’t be more different. While the S&P 500 in the US is powered by the “Magnificent 7” tech giants (Alphabet, Amazon, Apple, Meta, Microsoft, Nvidia, and Tesla), India’s BSE 500 is riding a wave of momentum from mid-cap and small-cap stocks
Contribution of the top 7 stocks to S&P 500 and BSE 500
* S&P 500: Just a couple of percentage points shy of its peak, with ~32-33% of its market cap dominated by the Magnificent 7 – a sharp rise in the contribution of the top 7 stocks from ~22% in 2000.
* BSE 500: After the recent dip, it’s ~12% below its all-time high. Interestingly, the top 7 companies now contribute ~23% to its market cap, down from ~30% in 2021 and ~28% in 2012.
In summary, The S&P 500’s performance has been heavily concentrated in its top players, while the BSE 500 tells a different story – its leadership has been taken by the mid- and small-cap stocks. This trend is further validated by Mid Cap/Sensex and Small Cap/Sensex ratios, both of which are at or near record highs.
Mid Cap/Sensex & Small Cap/Sensex Ratio
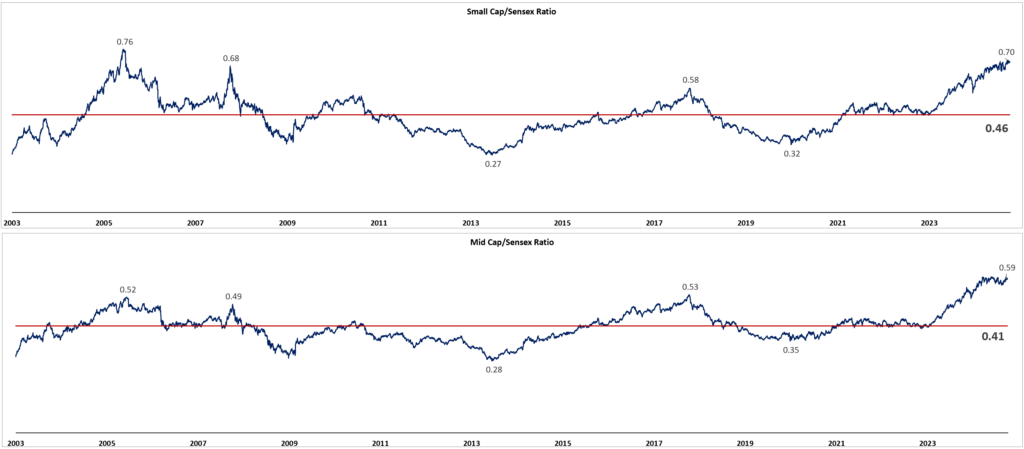
(Source: Exercises, Bastion Research)
Looking at these ratios, it’s natural to wonder, “Are we in the midst of a Small & Mid Cap bubble here in India?” While there’s no way to answer this with absolute certainty, we can certainly take a step back, analyze the current scenario, and reflect on investor behavior during past periods of euphoria. Let’s dive in and break it down from the very basics!
What is a Bubble?
In his latest memo, Howard Marks puts it very nicely, saying that a bubble is characterised by the following FOUR traits:
i) Irrational Exuberance (Logic takes a back seat) among investors
ii) Investors believe that subject companies can’t be missed
iii) Massive FOMO amongst investors
iv) Investors behave as if there is no price too high
THREE stages of a Bull Market
The journey of any company, asset or asset class reaching to a bull market phase is characterised by the following three stages:
i) Innovation (Innovator) – Very few insightful people are capable of envisaging the improvement.
ii) Acceptance (Imitator) – Most people start accepting and acknowledging the improvement.
iii) Story Forever (Idiot) – Now that a lot of facts are on the table, almost everyone concludes that the story will last forever and things will continue to get better.
One of the biggest red flags for sharp-eyed investors is the surge in participation from those with little to no financial background. As seasoned investors often warn, “When your barber, driver, or someone with minimal knowledge of companies and investing starts handing out stock tips, it’s a clear signal that the market has entered dangerous territory – and it’s time to resort to cautious investing behaviour.”
What Impairs Rational Thinking?
When we listen to this commonsensical sentence from wise investors, one basic question that crosses our mind is, if spotting a bubble is as simple as these experienced investors are saying, then “Why do investors fail to apply common sense and get caught up in bubbles, ending up with huge losses?”
In his memo, Howard Marks answers this question by pointing out THREE factors,
i) Its a State of Mind – Bubbles and crashes are more about psychology than numbers. They thrive on collective emotions, making it essential to have the mental fortitude to stand apart from the crowd.
ii) Newness – Every bubble carries an element of newness that fuels the belief: “This time, it’s different.” What often begins as rational excitement over innovation spirals into unchecked optimism as more people jump on the bandwagon. Even celebrated experts can get swept up in the euphoria, while those brave enough to challenge the hype become fewer and fewer. After all, who dares to tell the king his clothes are torn?
iii) No History to Fall Back on – Many overhyped assets or narratives lack a historical track record to validate their valuations. Consider today’s hot topics like artificial intelligence, data centers, or smart meters – how much historical data exists to confirm whether your investment is rational or speculative? In most cases, you’ll find little to none, leaving you navigating uncharted waters.
Why do stocks trade at a high PE?
Before diving into the reasons, let’s revisit the basics of the P/E ratio. The P/E ratio reflects how many times investors are willing to pay for a company’s current earnings. For example, buying a stock at a P/E of 50x means you’re essentially paying today for 50 years of the same earnings—betting on the continuity and growth of the business.
A business that receives a high PE today is because of reasons mentioned below:
i) Business Continuity and Stability – Investors assign higher P/E ratios to companies with strong visibility of sustained operations. The more predictable and stable the business, the more confidence investors have in its future.
ii) Profit Growth Potential – High P/E stocks often signal expectations of robust profit growth. The market rewards companies that demonstrate clear pathways to expanding their earnings over time.
iii) Ability to withstand competition – Companies with a strong ability to fend off competition – whether through innovation, brand strength, or operational efficiency, are often valued at a premium.
In essence, when the market assigns a high P/E to a stock, it reflects optimism about the company’s ability to thrive, grow profits, and outlast competitors.
Entry Valuations Matter
Before you jump to the conclusion that any P/E multiple can be justified for businesses showcasing exceptional qualities, let’s pause and reflect. It’s crucial to remember that entry valuations are very important. Overpaying, even for great businesses can lead to disappointing returns.
The chart below perfectly illustrates this point: no matter how strong a business appears, your price determines whether your investment thrives or falters. So, while high-quality companies deserve premium valuations, it’s equally important to ensure you’re not overpaying for future growth expectations.
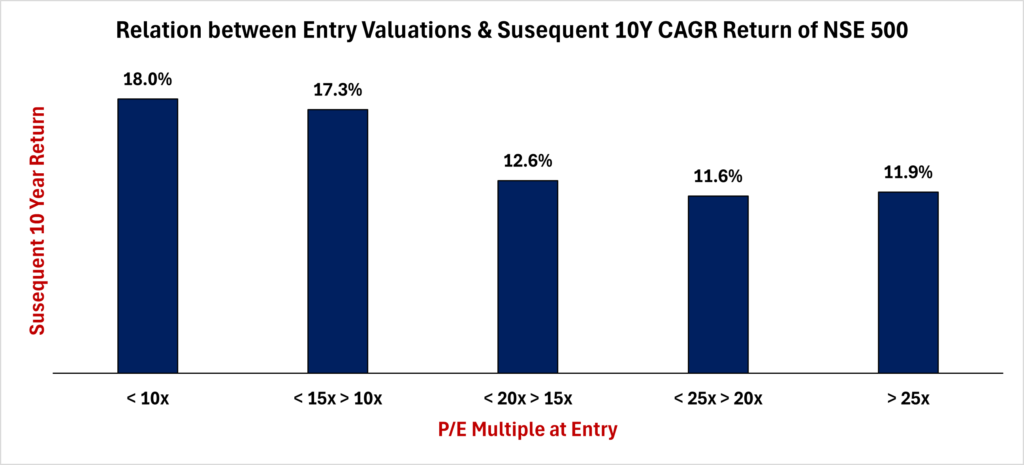
As you move up the PE ladder, the prospective CAGR return that you made in the next 10 years diminishes. It’s a straightforward concept that most investors understand in theory but often overlook in practice, especially when chasing flashy, high-flying sectors and themes.
Guiding Principles
Now that we know all the important things about a bubble, why investors stop thinking rationally and start giving a high PE multiple to stocks and the importance of entry valuations. Let’s look at the THREE guiding principles given by Howard Marks.
i) Its not what you buy, its what you pay that counts.
ii) Good investing is not about buying good things but about buying things well.
iii) There is no asset so good that it cannot be overpriced, and there few assets so bad that they can’t get cheap enough to be a bargain.
Questions – Don’t forget to give yourself a reality check
As we wrap up this newsletter, I want to leave you with a set of powerful questions to periodically reflect on. These will help you gauge the level of rationality in your recent investment decisions. My only suggestion? Be brutally honest with yourself. Self-awareness is your greatest ally in navigating the markets. Here are the questions to ponder:
i) Are you invested in assets where people are showcasing FOMO, behaving as if there is no price too high?
ii) When it comes to your latest investments, do you see yourself as an Innovator, an Imitator, or, dare we say, an Idiot?
iii) Are you hearing too many non-finance individuals around you giving stock tips on the same companies or sectors you’re invested in?
iv) Are your investments based on your own well-reasoned conviction, or are they a result of your inability to resist following the herd?
v) Have you invested in something with little to no history simply because you were drawn to its novelty?
As you reflect on these questions, remember that successful investing is not about following the crowd but about staying true to your convictions and maintaining rationality amidst the noise. The market will always tempt you with hype and euphoria, but your discipline and self-awareness will set you apart. Stay grounded, think long-term, and let wisdom, not emotions, guide your decisions.
Happy Investing!!!
Disclaimer: This newsletter is for educational purposes only and is not intended to provide any kind of investment advice. Please conduct your own research and consult your financial advisor before making any investment decisions based on the information shared in this newsletter.
MEME OF THE WEEK